1.3 Adding Filters / Columns
Creating Search Filters / Columns: This is very useful and will save you time in the long run. What we want to accomplish here is creating your most common filters of data you think you will most likely be looking to dissect out of the pcap.
Where to Start
A good start might be to look at user agents, request URIs, HTTP request methods or Kerberos CNameString if in an enterprise environment where Kerberos is utilized pretty heavily. The situation and end state matter, but these are some examples
Search Filter examples
-
-
user_agent
-
request.method
-
request.uri
-
request.full_uri
-
CNameString
-
Note** If any data matches this filter, you will see the packet list on the top pane change to show only that data you requested to see. This is only part of the battle. Next, you too add the column to see this data a lot easier, then you can drill down into it. The goal is to find things faster and more efficient, automate where you can.
Step 1. We are going to take what we did with add searching filters and create column’s that will show the data we filtered on. This helps make analyzing the data easier and more efficient
Go to Edit -> Preferences -> Columns or Ctrl+Shift+P (Linux).
See screenshots Below
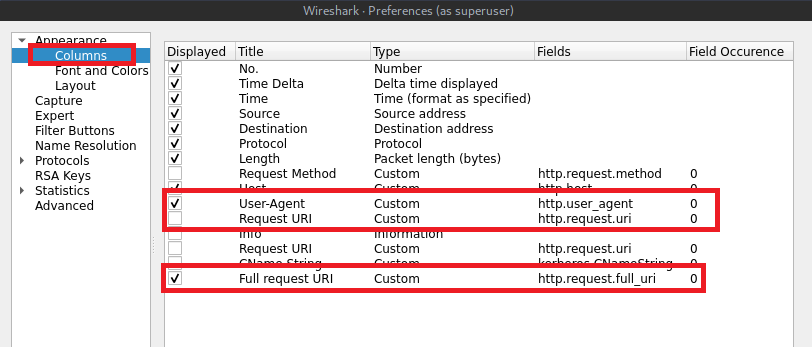


I wish I could zoom in, but if you notice, I have custom filters added which we discussed early. Any search you do, you can save that as a named button like I have. I combined search criteria as you can see in the above. I used the && operator signifying that I wanted to see http request method and the user agent. I then created the columns alike and clicked my search filter button, and just like that, the data I am looking for is front and center.